UBO Ownership Graphs
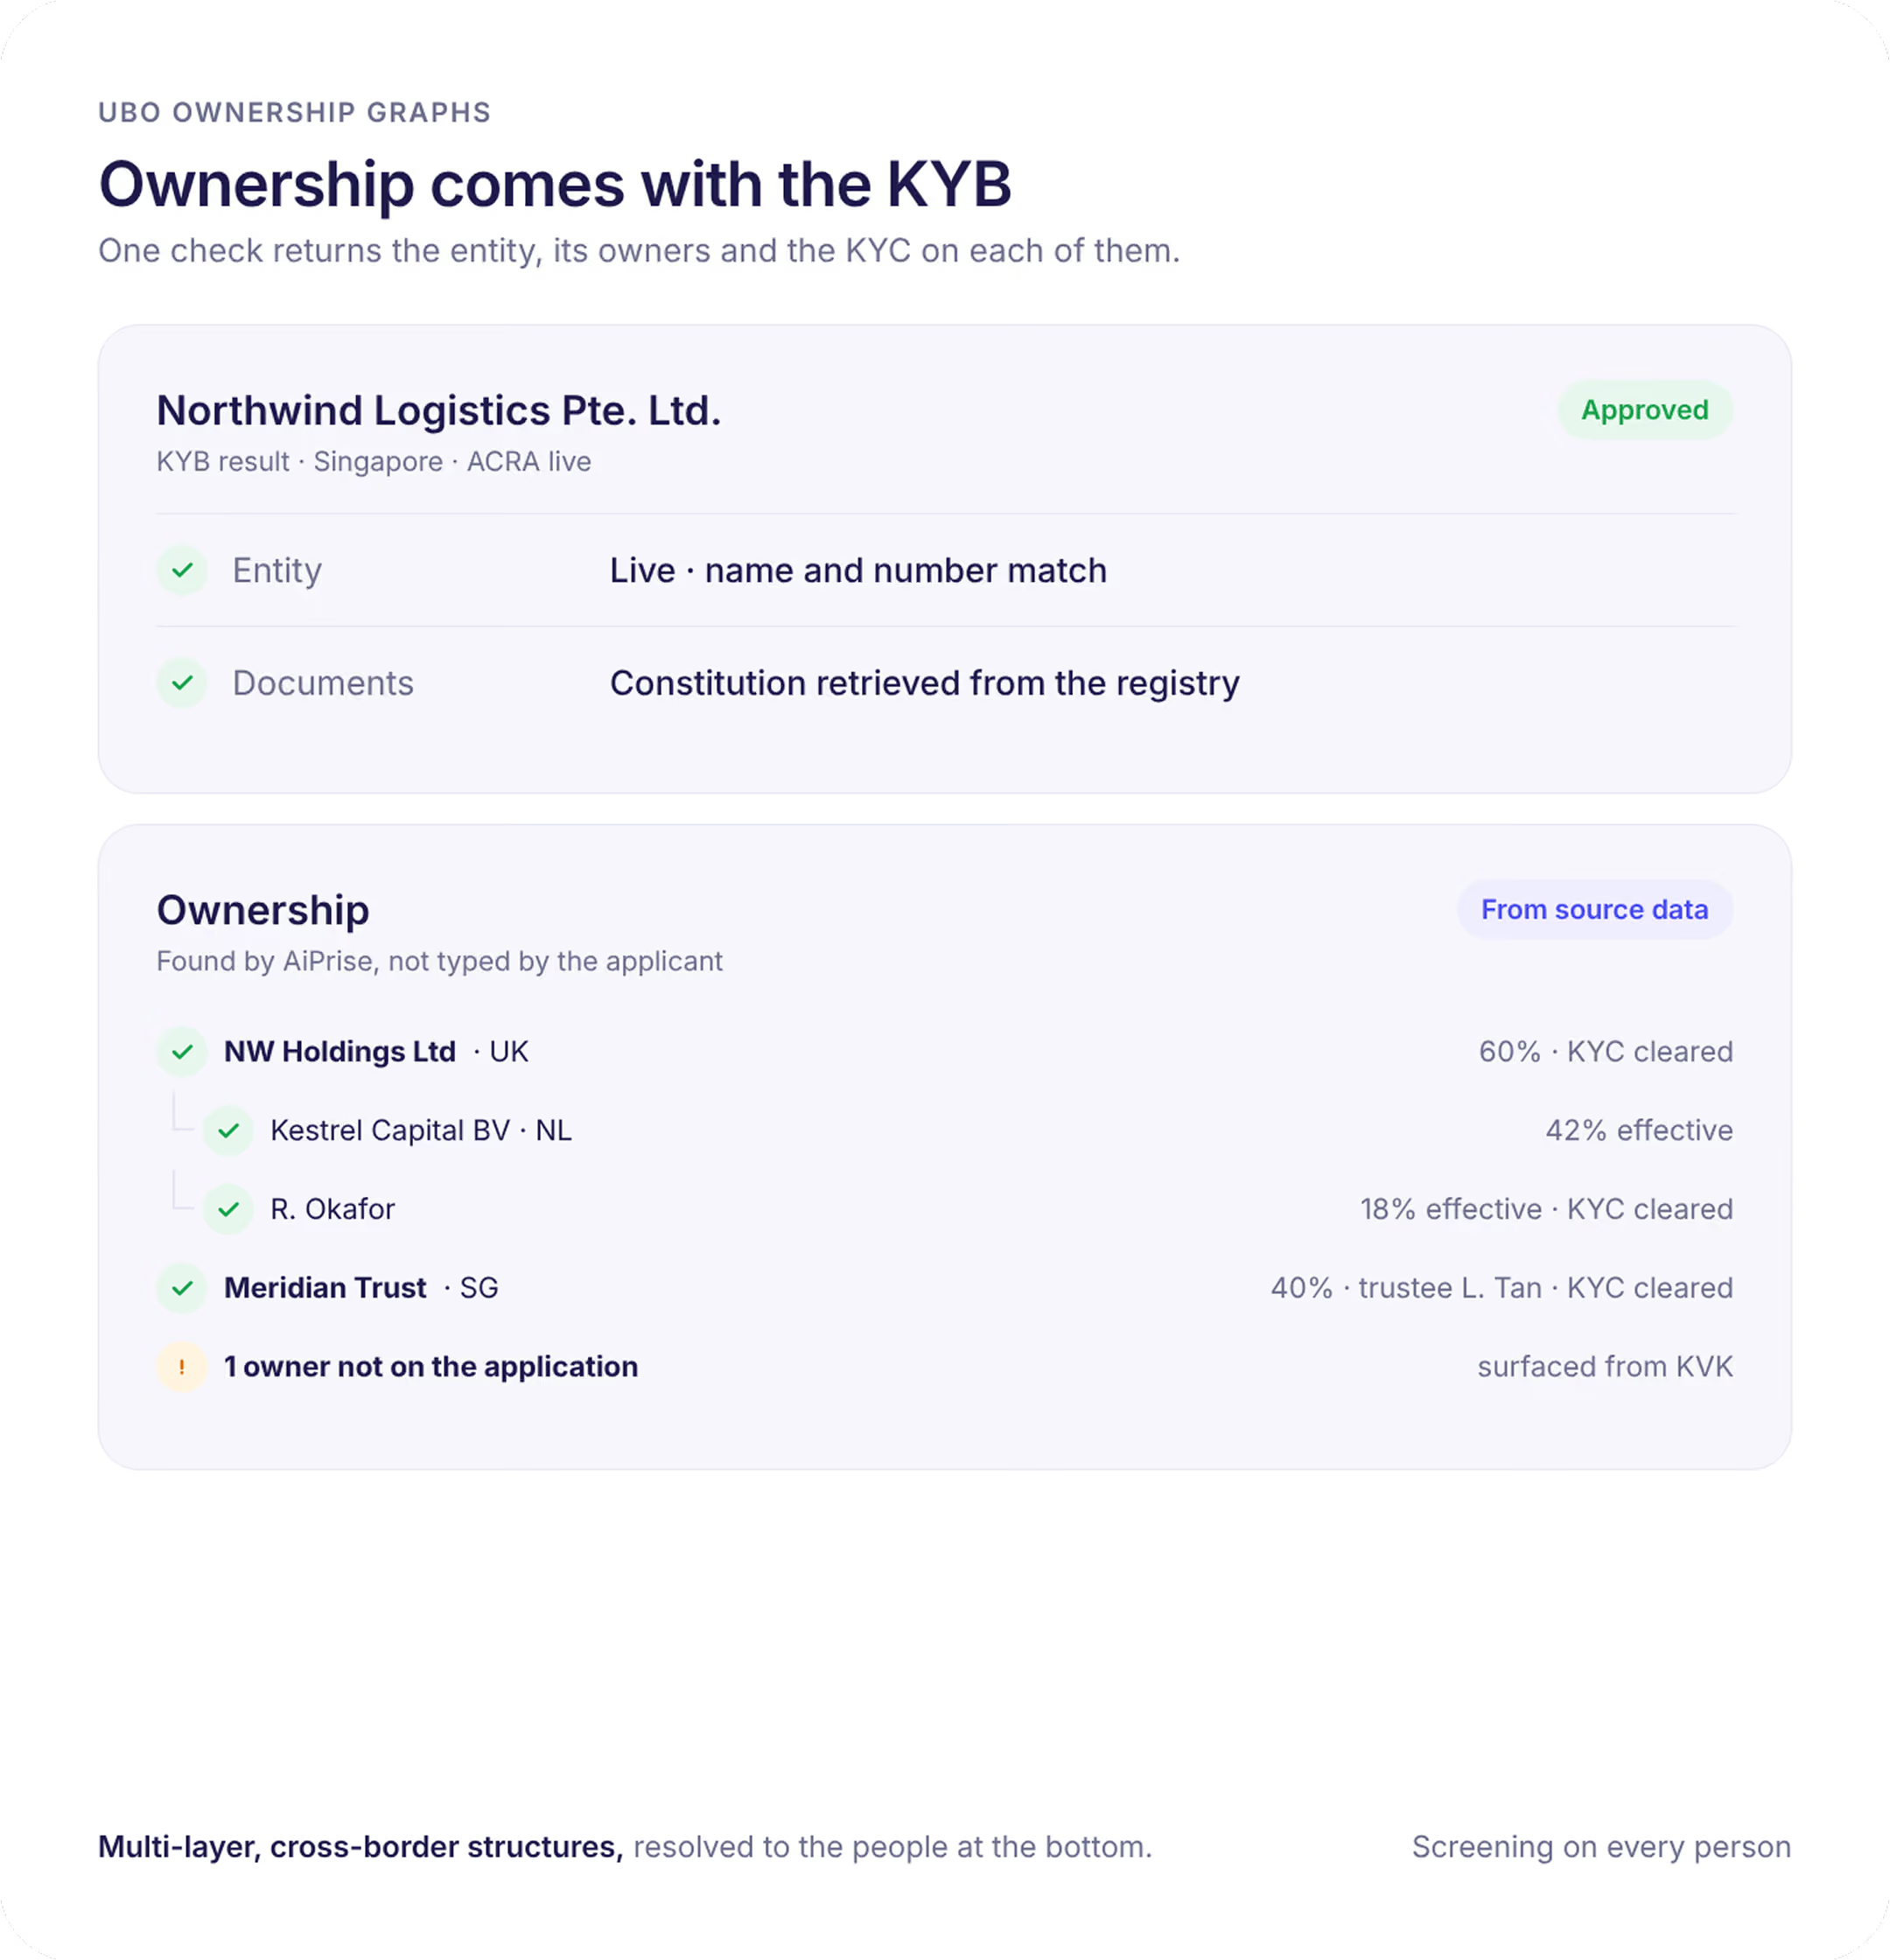
See who really owns a business. AiPrise builds the ownership structure from registry filings and the customer's own declaration, traces it through every holding layer to the natural persons at the top, and runs KYC and screening on each one. Analysts can correct and annotate the graph as they go.
Trusted by 200+ compliance teams



The owner is usually threecompanies and two countries away
AiPrise builds the structure for you, computes who actually controls the business, and turns every owner into a verified, screened person in the same case.

Three registries, three formats
Three registries, three formats
A UK business owned by a Dutch holding company owned by a Cayman fund means three registries, three formats, and a spreadsheet to add it up.
Declared and filed disagree
Declared and filed disagree
What the customer declares and what the registry shows do not always match, and the difference is where the risk hides.
Hand-drawn charts prove nothing
Hand-drawn charts prove nothing
Ownership charts drawn by hand in a slide deck cannot be audited, updated, or trusted.
What the graphshows
When a registry is incomplete, the analyst adds an owner from the ones the Document Insights Agent found in a shareholder register or trust deed, corrects a percentage, and records the source. Every edit is attributed and kept in the audit trail.
Every layer
Every layer
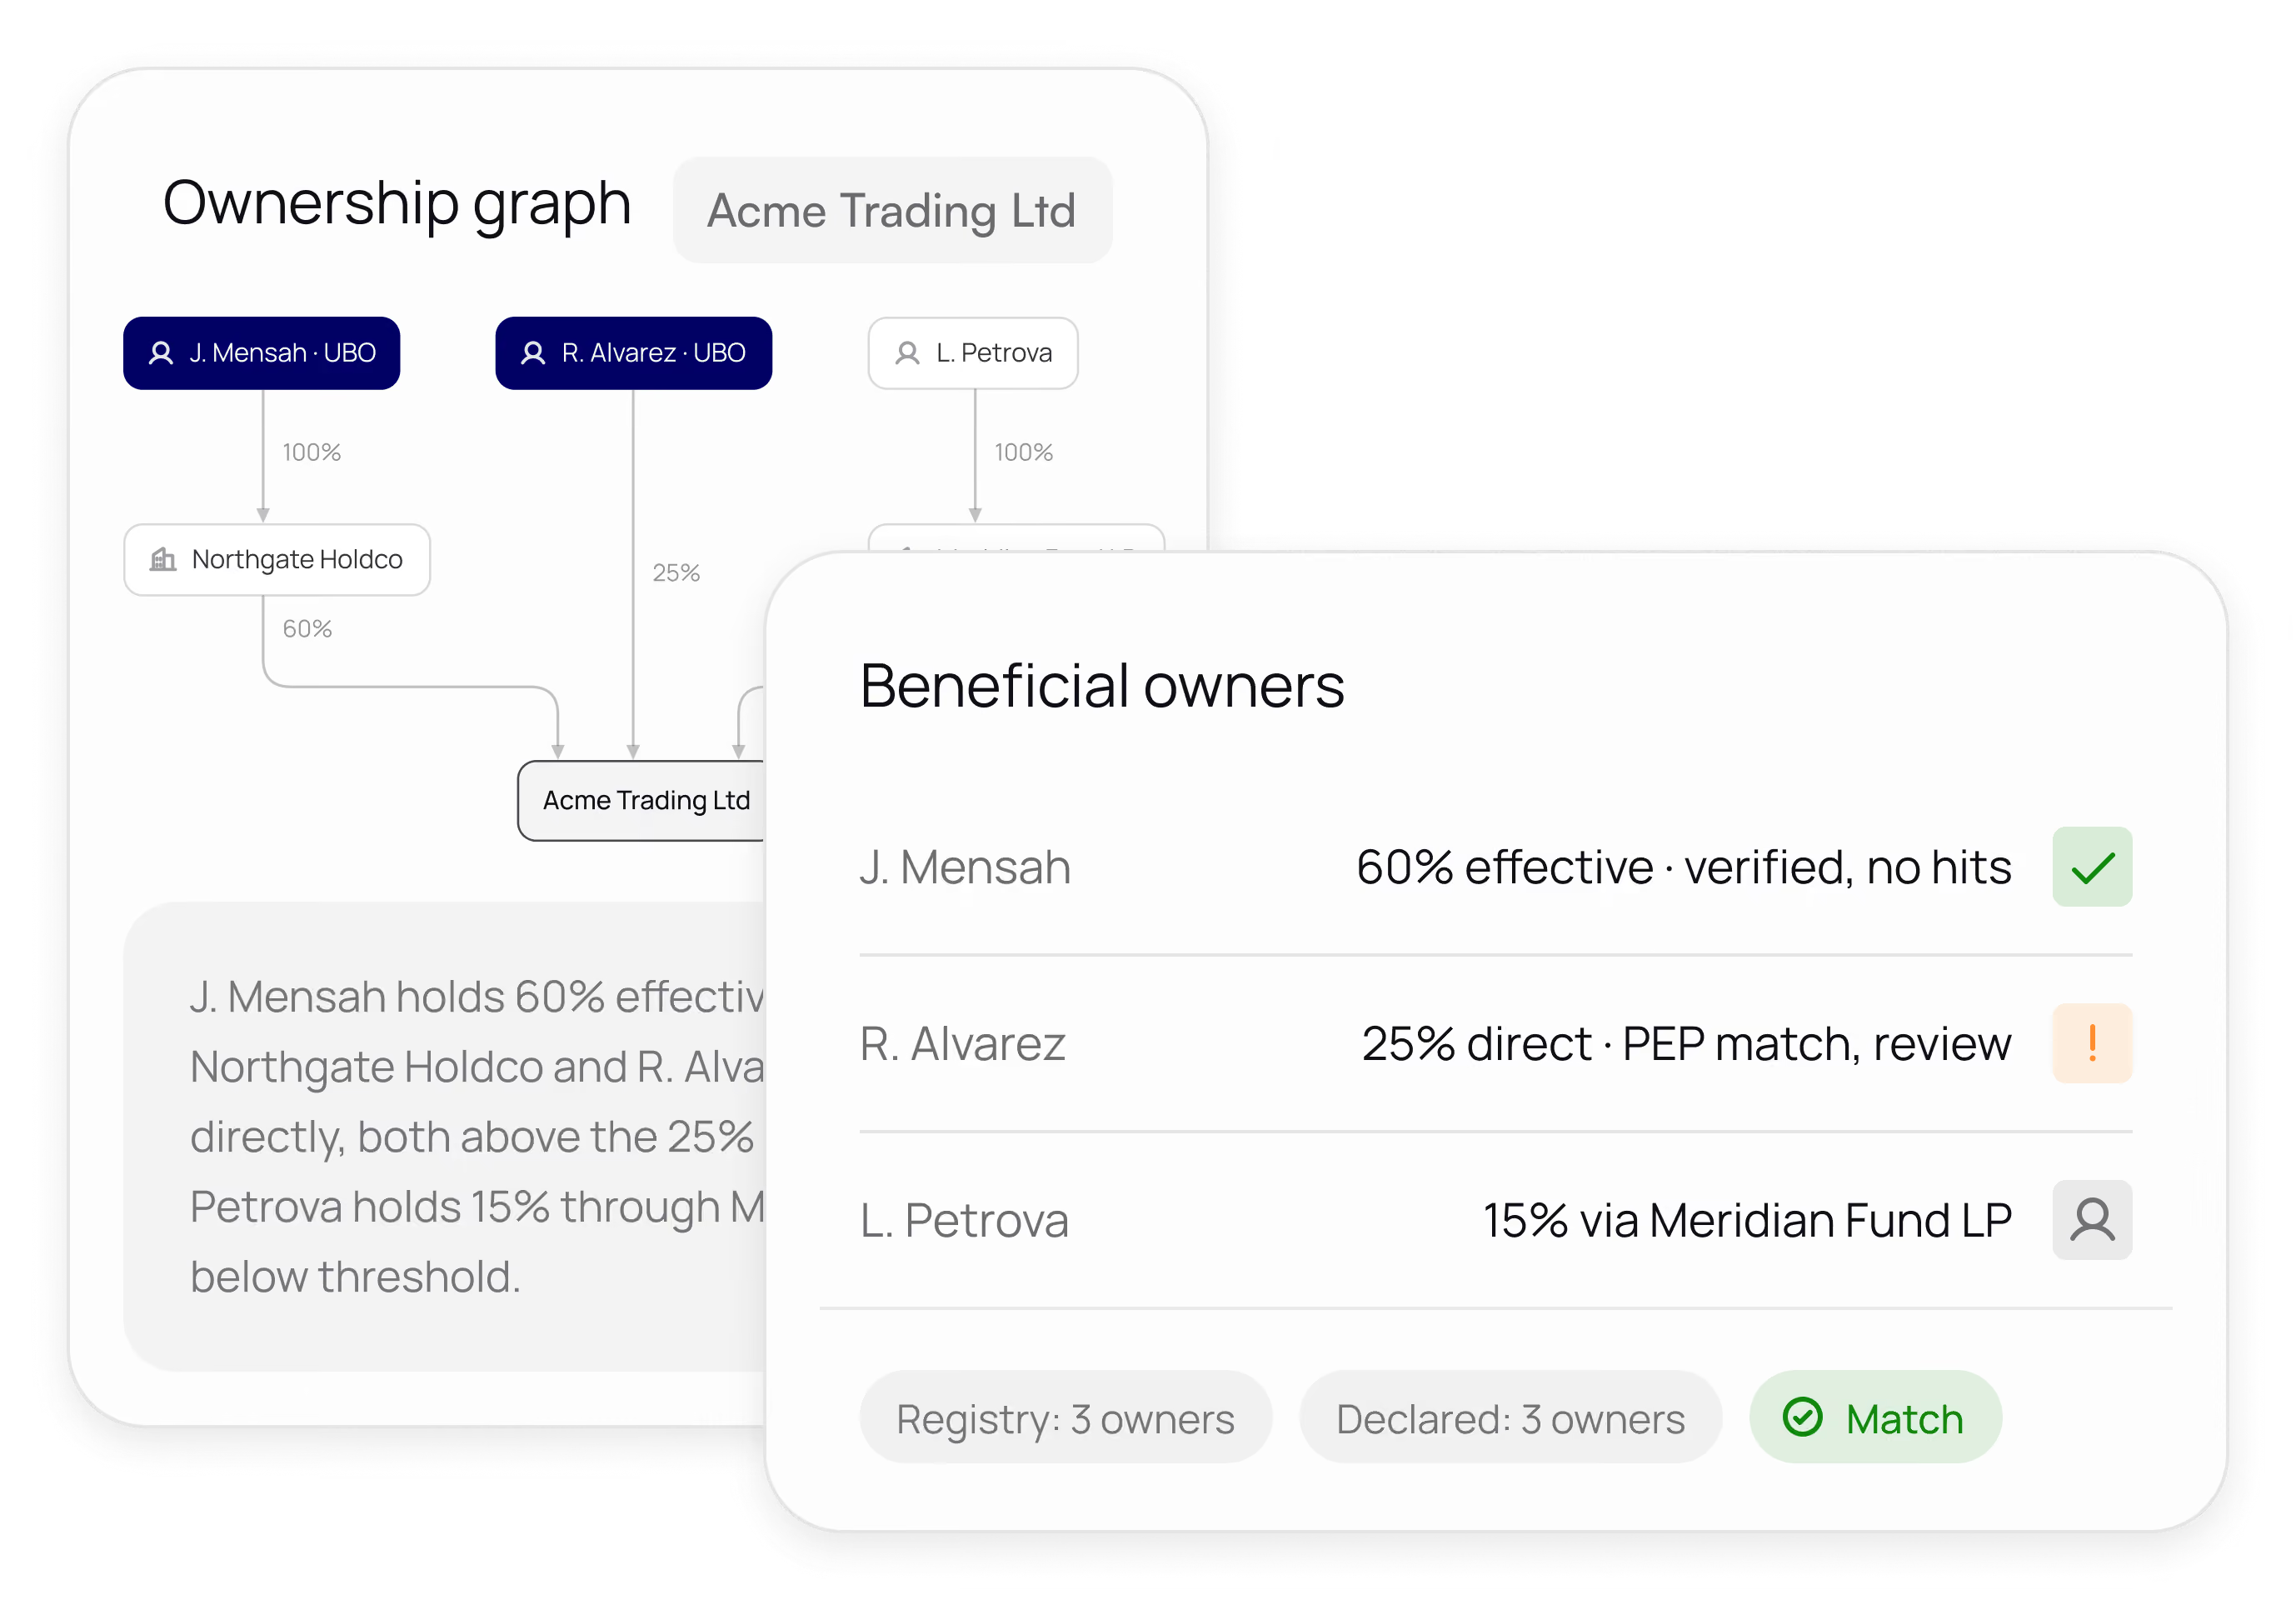
The target business, each intermediate entity, and the natural persons at the top, across jurisdictions, with the ownership percentage on every link.
Effective ownership
Effective ownership
Indirect holdings are multiplied through the chain so a 60% stake in a holding company that owns 100% shows as 60% of the business, not two disconnected numbers.
Declared versus registry
Declared versus registry
The structure the customer declared in onboarding sits against what the registries show. Missing owners, extra owners, and different percentages are flagged.
Verified owners
Verified owners
Every person above your threshold is run through KYC, sanctions and PEP screening, and risk scoring. Their status shows on the graph.
How it works
The graph is captured at onboarding. Re-running KYB or reverification captures a fresh one to compare against.
Gather
Registry filings for the business and each parent entity are pulled from 200+ countries. The customer declares owners in the onboarding flow, and the Document Insights Agent extracts shareholders from registers, org charts, and trust documents.
Resolve
Entities are matched across registries, the chain is followed until natural persons are reached, and effective ownership is computed. Owners above your threshold, 25% by default and configurable, are marked as UBOs.
Verify
Each UBO is verified and screened, and the graph, the discrepancies, and the results land in the business case for review. Athena Agent (AiPrise's AI business reviewer) uses the ownership picture in her verdict.
Your thresholds, your evidence
Threshold per market
Threshold per market
25% for standard due diligence, 10% or lower for enhanced due diligence or high-risk industries, set per jurisdiction and product.
Edit and annotate
Edit and annotate
Add, remove, or correct entities and percentages, attach the source document, and leave notes for the next reviewer.
One case
One case
The graph lives inside the business case alongside registry data, documents, screening, and agent findings. Click any owner to open their profile.
Audit trail
Audit trail
Every data source, computation, edit, and verification is recorded, so the ownership determination can be defended to a regulator months later.
Ownership clarity for every market
Payments
Identify and verify merchant owners before settling to the account.
Neobanks
Open SMB accounts with UBO checks that satisfy the regulator without a week of back and forth.
Financial institutions
Meet beneficial ownership rules across jurisdictions with one defensible determination per client.
Stablecoins and crypto
See through layered structures used by institutional counterparties.
Lending
Know who stands behind a borrowing entity before disbursement.
Marketplaces
Verify the people behind seller entities, not just the entity.

Part of every KYB,not a separate product
Dashboard
The graph renders inside the business case. View, edit, and annotate without leaving the review.
API
Receive the resolved structure as structured data: entities, links, percentages, effective ownership, and verification status per owner.
Onboarding SDK
Collect declared owners and their documents in the same flow, and hand each UBO straight into KYC.